The exponential utility function (EUF) provides a way to make logical, consistent trade-offs between risk and value. For the most popular utility function shape, the decision maker need only determine his or her risk tolerance coefficient (r). Higher risk tolerance means a higher (r).
Here is the utility equation that translates an objective measure of monetary value, $ or NPV $, into a risk-attitude-adjusted utility value:
where:
| U = | utility value in risk-neutral dollars (RN$) (in the U.S. and other countries using the $ symbol) |
| x = | objective outcome value, usually NPV $ |
| r = | risk tolerance coefficient, typically on the order of 1/5 of the decision maker’s or organization’s net worth |
r scales the curvature of the utility function.
Conceptually, answering just one risk question will determine your r, and that will apply to all decisions with risk where outcomes are measured in NPV$.
For extreme outcome values, the exponential shape may not fit the decision maker’s risk preference. Many academics and practitioners advocate for utility functions with decreasing risk-aversion, such as U = Log(ending wealth). The problem is, if we use something other than an EUF, then we lose the highly-desirable delta property.
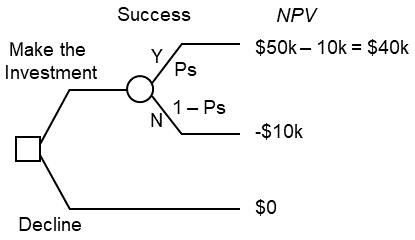
Suppose a trustworthy person approaches you with this investment opportunity:
If you are risk-neutral, the usual decision analysis approach is to calculate expected monetary values (EMVs) for each alternative. The alternative is this problem is Don’t Invest, with a reference zero value.
Here is a decision tree model for this thought experiment:
As an example calculation, suppose that you judge that Ps = 0.3. Your estimate of the investment’s value is:
EMV = -$10,000 + .3 x $50,000 = $5,000
Would you make the investment?
Although EMV is positive, you might be concerned that the most likely outcome is -$10,000. This is the type of problem that risk policy addresses.
Question: What is the minimum Ps where you would be just willing to make this investment? Try not to look ahead.
Solutions
If your answer for Ps > 0.20, then you are risk-seeking. You might enjoy gambling at casinos where the odds are against you. EMV is negative.
If your answer for Ps = 0.20 exactly, your r = ∞. For this investment, EMV = $0. Your CE is also $0.
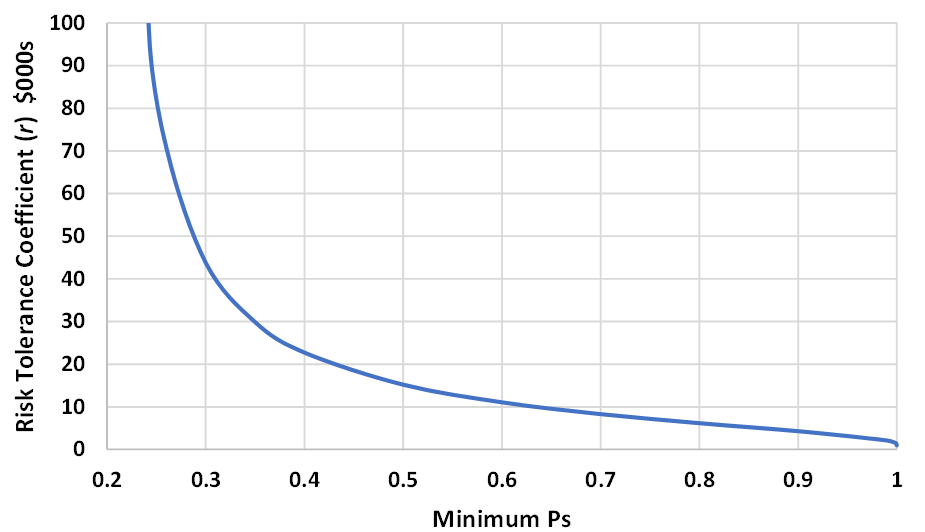
If your minimum Ps > 0.20, then you are risk-averse, and we can work with that. The next chart translates your Ps into r.
Translating Ps into r. For example, if your Ps answer is 0.40, that imputes that your r = $22.8k.
Typically, determining r requires a series of “lottery” experiments. Through practice and feedback, the executive or decision board develops intuition about how utility works and becomes calibrated for risk policy. Pick an average r amoung your experiments, and that is your risk policy. Publish r, and perhaps the utility curve, to decision makers in the organization.
Risk policy should be stable until the company’s situation changes. In some of my corporate models, I adjust r in proportion to changed enterprise value.
Utility Elicitation Program is a free (for most users) automated tool to help you self-assess r’s through several lottery types. Access UEP at http://www.maxvalue.com/online.htm.
UEP generates random questions scaled to the user’s typical maximum investment and allows a currency label of choice. Questions may be in selected or random Buy or Sell perspective. Question formats have these assessment types, also selected or random:
© 2020 John R. Schuyler. www.maxvalue.com